The zebrafish brain as a map
Researchers at the Max Planck Institute for Biological Intelligence have assembled data on gene expression in the zebrafish brain in an interactive online atlas
März 2023

© Max Planck Institute for Biological Intelligence/Dr. Inbal Shainer & Enrico Kuehn
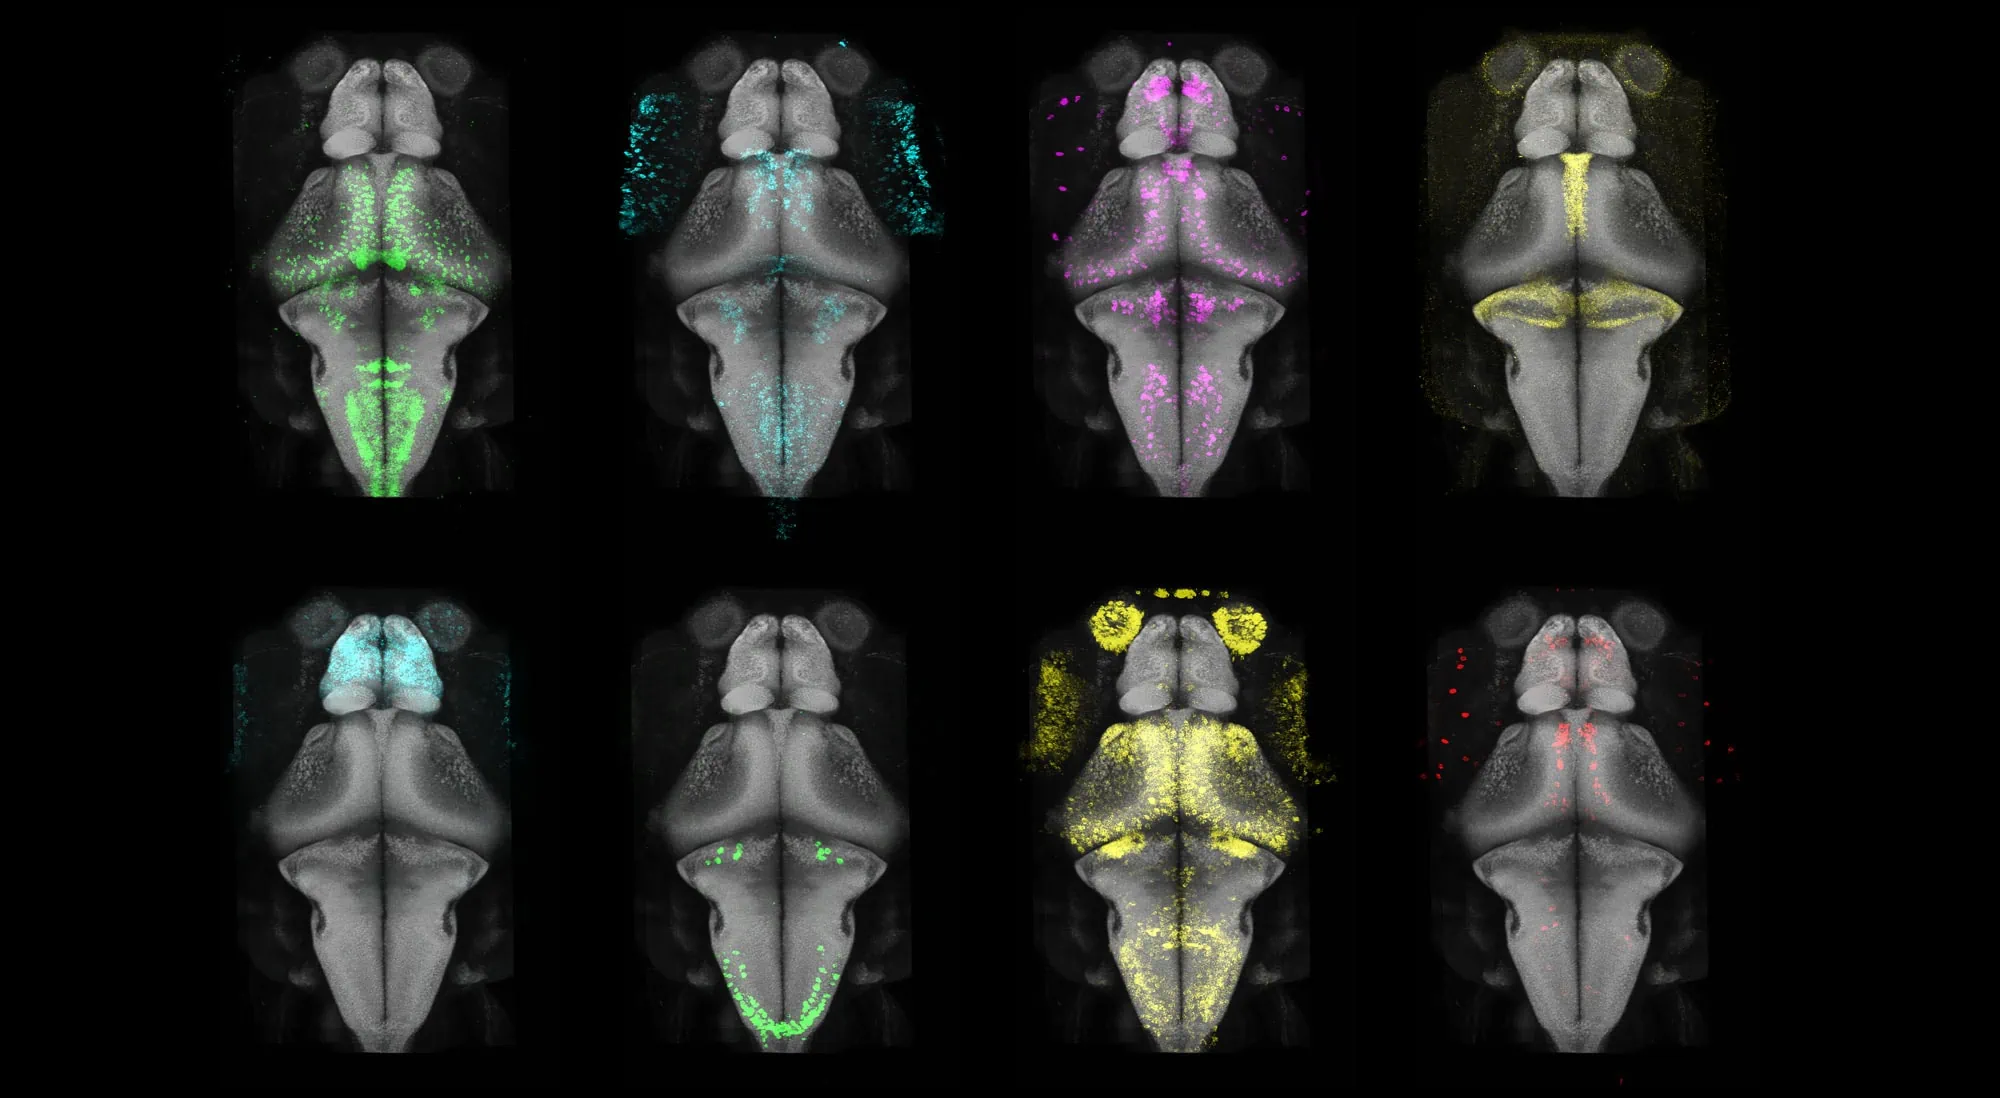
A selection of gene expression maps that have now been included in the Max Planck Zebrafish Brain (mapzebrain) atlas. The researchers mapped gene expression across the entire zebrafish brain at single-cell resolution.
“Combining different datasets allows the zebrafish research community to gain entirely new insights into the genetic basis of brain function. This will enable us to better understand how brains develop and how they operate,”
Dr. Inbal Shainer, postdoctoral researcher in Dr. rer. nat. Herwig Baier’s department
´´
When one travels through rough terrain, maps come in handy. They also help researchers to study the complex organization of the brain. Scientists at the Max Planck Institute for Biological Intelligence in Martinsried near Munich have created a new set of maps for the zebrafish brain. They determined the activity of hundreds of genes with single-cell resolution and assembled the maps into an interactive atlas. The online resource supports researchers in finding their way around the brain of this vertebrate and provides new insights into neural structure and function.
An intricate network of brain cells (neurons) enables zebrafish to sense their environment, find food or mating partners and escape predators. All of these cells harbor the same genetic information, yet they specialize in different functions. It’s the expression of certain genes – the process of copying the genetic information into messenger RNAs and translating them into proteins – that determines a neuron’s shape, connectivity and role in behavior. Neurons with similar properties belong to the same type. It is estimated that there are hundreds, if not thousands, of different types in a fish brain. Similar numbers apply to the human brain.
Knowing which genes are expressed and where helps researchers to understand how the brain functions and how it controls zebrafish behavior. However, the neuronal cell types that underly a specific behavior are notoriously difficult to unravel, and the maps that help scientists find their way around the brain have many blank spots.
“We previously had only limited information on gene expression in the zebrafish brain,” explains Dr. Inbal Shainer, a postdoctoral researcher in the department of Dr. rer. nat. Herwig Baier, Director at the Max Planck Institute of Neurobiology. “The data was low in resolution and could not be combined with the latest cell type and brain structure maps. Our work now fills this gap.”
To reduce the blank spots in existing maps, Dr. Inbal Shainer, Enrico Kuehn and their colleagues used a method that makes the expression of individual genes visible under the microscope. The method is sensitive enough to detect differences in gene expression across the entire zebrafish brain at very high resolution – down to the level of single cells.
From the obtained data, the researchers prepared an expression map for each gene and merged hundreds of these maps into an atlas. The new gene expression atlas integrates seamlessly with the existing data of the Max Planck Zebrafish Brain (mapzebrain) atlas, which contains information on brain structures, cell types, and the connections between cells. By looking at these features and the gene expression combined, scientists can get a more holistic picture of how information is processed in the zebrafish brain.
For example, the researchers studied how environmental stimuli change the expression of the cfos gene – a marker for highly active nerve cells. When a young zebrafish took in food, the cfos gene expression increased in areas of the brain that detect prey and control hunting movements, but also in a group of cells that are connected to the lateral hypothalamus, a brain region involved in signaling hunger and satiety.
“Including the gene expression into mapzebrain has already provided us with exciting new insights. Follow-up experiments will show if the cells we found are indeed eliciting a satiety signal,” says Enrico Kuehn, molecular biologist in Dr. rer. nat. Herwig Baier’s department.
The zebrafish atlas is an open-source online tool, and the research community is constantly contributing data to the existing datasets. Scientists can inspect and analyze images online, download them to their devices, or connect the atlas with other online tools.
The researchers in Dr. rer. nat. Herwig Baier’s department are optimistic that the mapzebrain atlas will continue to grow, as more genes and more detailed maps of brain cells are being added. As a next step, the team aims to include information on neuronal circuits that was recently obtained by electron microscopy. “Combining different datasets allows the zebrafish research community to gain entirely new insights into the genetic basis of brain function. This will enable us to better understand how brains develop and how they operate,” concludes Dr. Inbal Shainer.


